

Reports
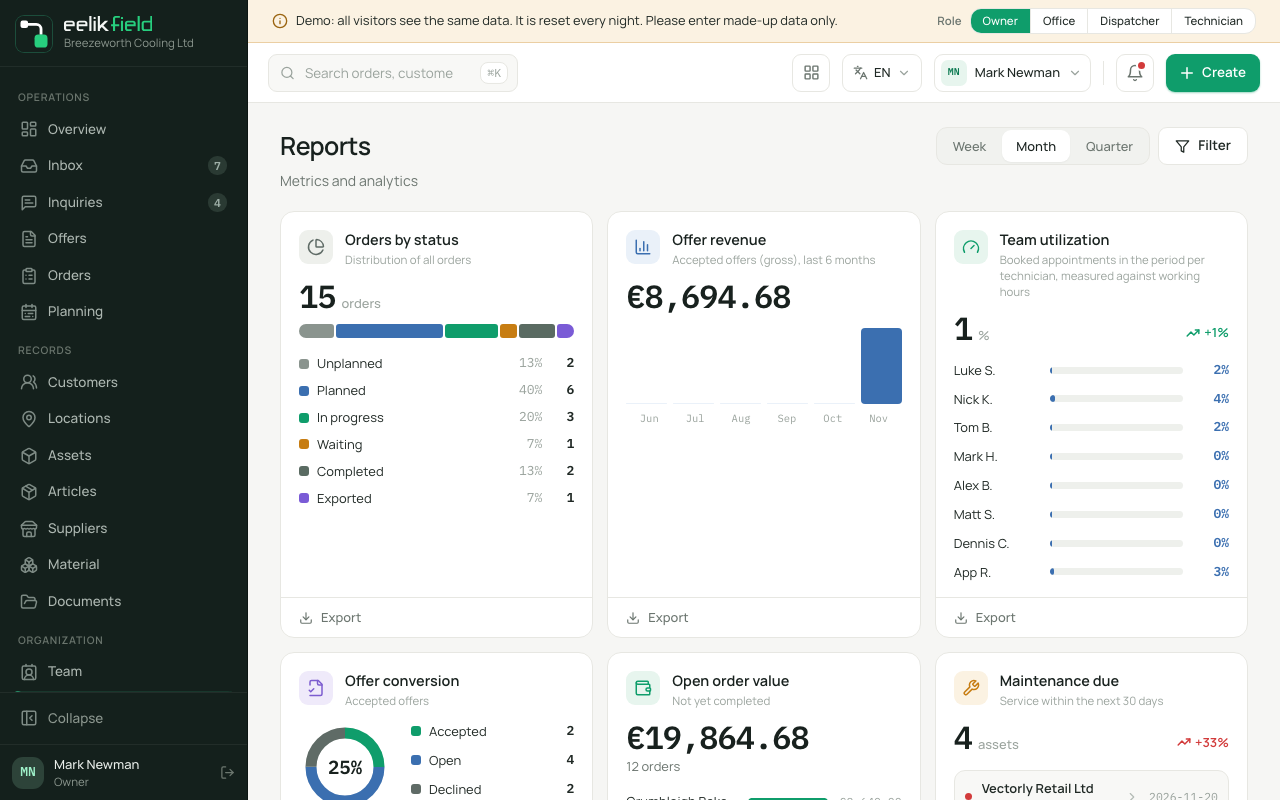
Under “Reports” you see six key figures that help you keep an overview of your business: how many orders are at which stage, what your offers bring in, how busy your team is, how much work is still open and which maintenance jobs are coming up. All the figures come from the data that you and your technicians record anyway.
The page is called “Reports” in the menu. Its subtitle is “Metrics and analytics”. The work report of an order is not one of these reports. You find that under Work report.
Choosing the time period
Section titled “Choosing the time period”At the top right you choose the time period: “Week”, “Month” or “Quarter”. The page then recalculates. You find the same choice in the menu “Filter”. It means the last days up to and including today:
| Choice | Time period |
|---|---|
| “Week” | the last 7 days |
| “Month” | the last 30 days |
| “Quarter” | the last 90 days |
For several key figures, a change “vs. previous period” is shown. The previous period is the period of the same length directly before.
The six key figures
Section titled “The six key figures”“Orders by status”
Section titled ““Orders by status””“Distribution of all orders”: a large number (how many orders there are), a bar and a list of how many orders are in which group, as a percentage and as a number. All orders are counted, not only those of the period. The groups are “Unplanned”, “Planned”, “In progress”, “Waiting for material”, “Completed”, “Exported” and “Cancelled”. A group appears if there are orders in it.
- “Exported”: Orders whose invoice was handed over to e-računi as a draft (see Exporting data). An order that was reopened after the export counts under its current status.
- “Cancelled”: Orders that you ended with “Cancel order”.
- “Completed”: finished orders, including those that are released for the ERP export but not exported yet.
- “Planned”, “In progress” and “Waiting for material” also include older orders with the statuses “Ready”, “For review” and “Blocked”. New orders do not get these statuses.
The change from the previous period compares how many orders were created in the period.
“Offer revenue”
Section titled ““Offer revenue””“Accepted offers (gross), last 6 months”: The total of the accepted offers as a large number and below it one bar per calendar month. Point at a bar with the mouse to see the month and the amount. These are the gross amounts of the offers that the customer accepted in the month in question, in the currency of your business. They are not invoices issued. This report does not depend on the time period you chose.
“Team utilization”
Section titled ““Team utilization””The subtitle reads “Booked appointments in the period per technician, measured against working hours”. The average utilisation is shown as a large percentage, and below it a bar for each person who can be scheduled. This is how it is calculated: the booked hours of all appointments in the period that are neither cancelled nor rescheduled, divided by the working time of the person. For each day of the period, the working time counted is the working time of your business (“Working hours” in the settings). If the person has their own working time on the Team page, it replaces that of the business on the weekday in question. Days on which the person is absent do not count as available time. The page does not show more than 100 per cent. A person who is absent at the moment is grey. The names are shortened to first name and initial of the surname.
Utilisation is therefore calculated like the planning board (see Planning board and Working hours).
“Offer conversion”
Section titled ““Offer conversion””“Accepted offers”: A ring with the rate and a legend: “Accepted”, “Open”, “Declined”. The whole stock of offers counts. “Open” are drafts, reviewed offers, sent offers and offers with a query (plus older “opened” ones). Under “Declined” you find declined offers and, for older offers, expired ones. The rate is the share of accepted offers among all. Below it is the “Open offer value”, the gross total of all open offers. The change shows the acceptance rate of the offers that were decided in the period, compared with the previous period, in percentage points.
“Open order value”
Section titled ““Open order value””“Not yet completed”: The total of the order values of all orders that are neither completed nor cancelled, the number of these orders and the four customers with the largest amounts. The order value comes from the field “Order value” when the order is created (see Orders). Orders without a value contribute nothing.
“Maintenance due”
Section titled ““Maintenance due””“Service within the next 30 days”: The number of assets that need attention, and the list with customer, manufacturer, model and date. This includes assets whose next maintenance is due in the next 30 days (also those already overdue) and assets with the condition “Service due” or “Faulty”. Faulty ones come first and are marked red. A click on a row opens the asset. Removed assets and those set to “Out of service” do not count. The maintenance date comes from the asset (see Assets).
Exporting
Section titled “Exporting”Each of the six cards has an “Export” button at the top right. It downloads the figures of exactly that card as a table (a file with a semicolon as separator, which Excel opens). You find more under Exporting data.
When it says “No data”
Section titled “When it says “No data””If a card says “No data: The report will appear here as soon as there is data.”, there is nothing to count yet for that key figure, for example no accepted offer yet. In a new business, most cards are empty at first.
What does not exist
Section titled “What does not exist”- No report on working times. You see the times that technicians record per order in the tab “Time entries” and in the work report. A total across all orders, customers or technicians does not exist.
- No invoices and no revenue from invoices. Revenue comes from accepted offers.
- No custom reports. You cannot change the cards or create new ones.
- No maintenance contracts and no recurring orders. The card “Maintenance due” follows the maintenance interval that you enter on the asset.
Frequently asked questions
Section titled “Frequently asked questions”Why does the number under “Orders by status” differ from my order list? The card groups older statuses together (see above), and “Exported” follows the ERP state of the order. That is why it differs, for example, from the view “Completed”.
How do I get to the list behind a number? On the overview, the tiles lead to the lists (see Overview). On the page “Reports”, only “Maintenance due” leads to the assets.
Where do I see how busy someone is on a day? On the planning board. There you find the utilisation per person and day (see Planning board).